Uptime Logs
Publisher: Psychz Networks, June 04,2018This document focuses on the steps by which you can access the Uptime Logs and its features. The Uptime Logs are the logs provided to the customers to view their device’s performance. You can view the total uptime of your device and also the time duration during which the device has been down. These logs are available for both dedicated and colocation devices. With the help of uptime logs, you can monitor specific ports. You can also monitor devices on the basis of specific protocols such as ICMP, ping etc.
Please follow the below steps to access the Uptime Logs.
1. Please click on the following link to login in to the client dashboard.
https://www.psychz.net/dashboard/client/web/
(Note: You will require username and password to login to your account)
2. On the left-hand side of the main page a drop-down menu is displayed. Go to Services/Devices > Devices
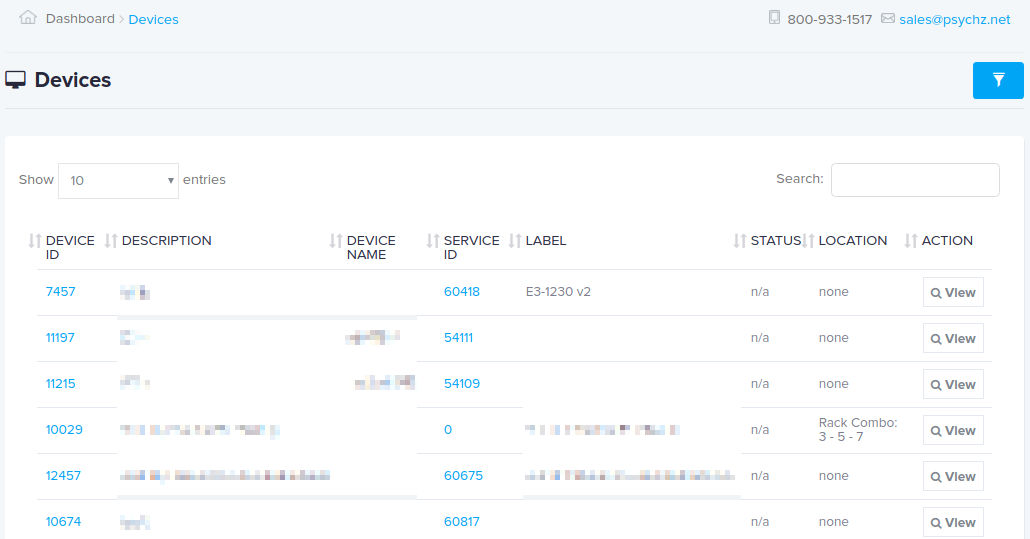
3. The Devices page displays a list of all the devices associated with your account.

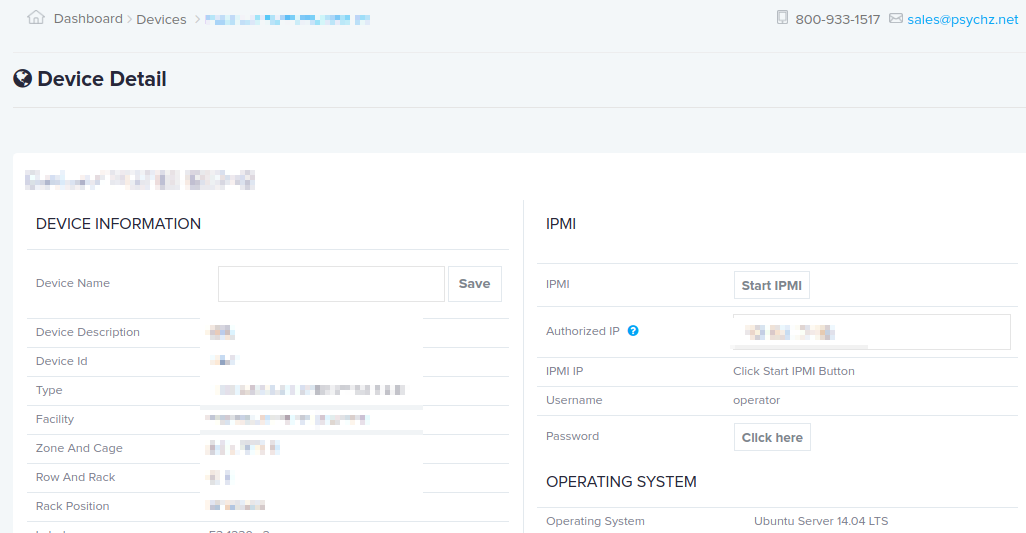
4. Click on the “View” button on the right-side of any device to view all the information associated with the device.

5. Along with other options, the “Device Status” option is displayed. Click on it to view the monitors.

6. The “Monitors” page contains the following fields.

a. Protocol – The name of the protocol you want to monitor.
b. IP address – The IP address of the device.
c. Port – The port number of the protocol.
d. Notify Address – The e-mail address you want the notification to be sent to.
e. Notify Delay – It is the time period the monitor will wait before sending you the notification.
f. Renotify Interval – The interval at which the notification is sent again to the customer.
g. Status – It indicates the status of the protocol.
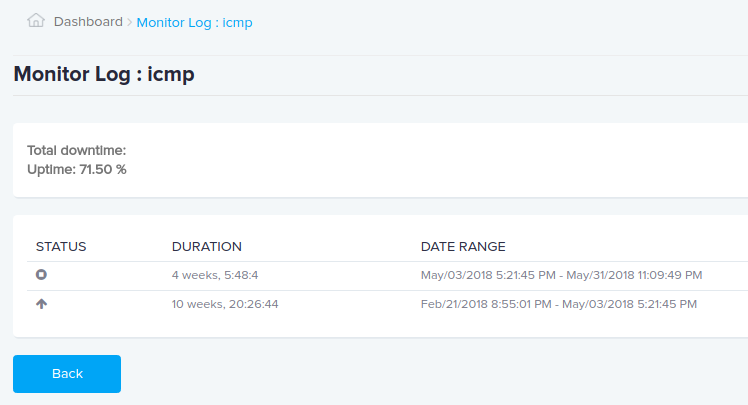
h. Action – Click on the “View Log” button to view the detailed information about the protocol status like the status of the protocol, the duration of the status and the date range of the status.


